
Your rating is what homeowners see. Your review velocity is what Google rewards. Here is the math connecting the reviews you earn each month to the jobs on your schedule.
Review velocity is the rate at which new Google reviews land on your profile each month, and it is one of the heaviest ranking factors in the local map pack for roofing keywords. A roofer earning 6 to 10 fresh reviews a month will consistently outrank an otherwise identical competitor sitting on a bigger but aging review total, and that ranking gap converts directly into more calls, more estimates, and more closed jobs.
Most roofing owners obsess over their star rating and total review count. Those are the visible numbers. But under the hood, Google watches momentum: when your last review arrived, how steady the flow is, and whether the pattern looks real. This post works the math on exactly what review velocity is worth in dollars for a roofing company, with a real example and the numbers you can run for your own company.
Quick Answer:
Review velocity is the number of new reviews per month, and roofing companies that hold 6 to 10+ reviews per month typically hold top-3 map pack positions, earning roughly 30 to 50 percent of local pack clicks (illustrative), which for a typical roofer means 5 to 15 extra estimate opportunities a month and $40,000 to $150,000 in additional annual revenue at normal close rates.
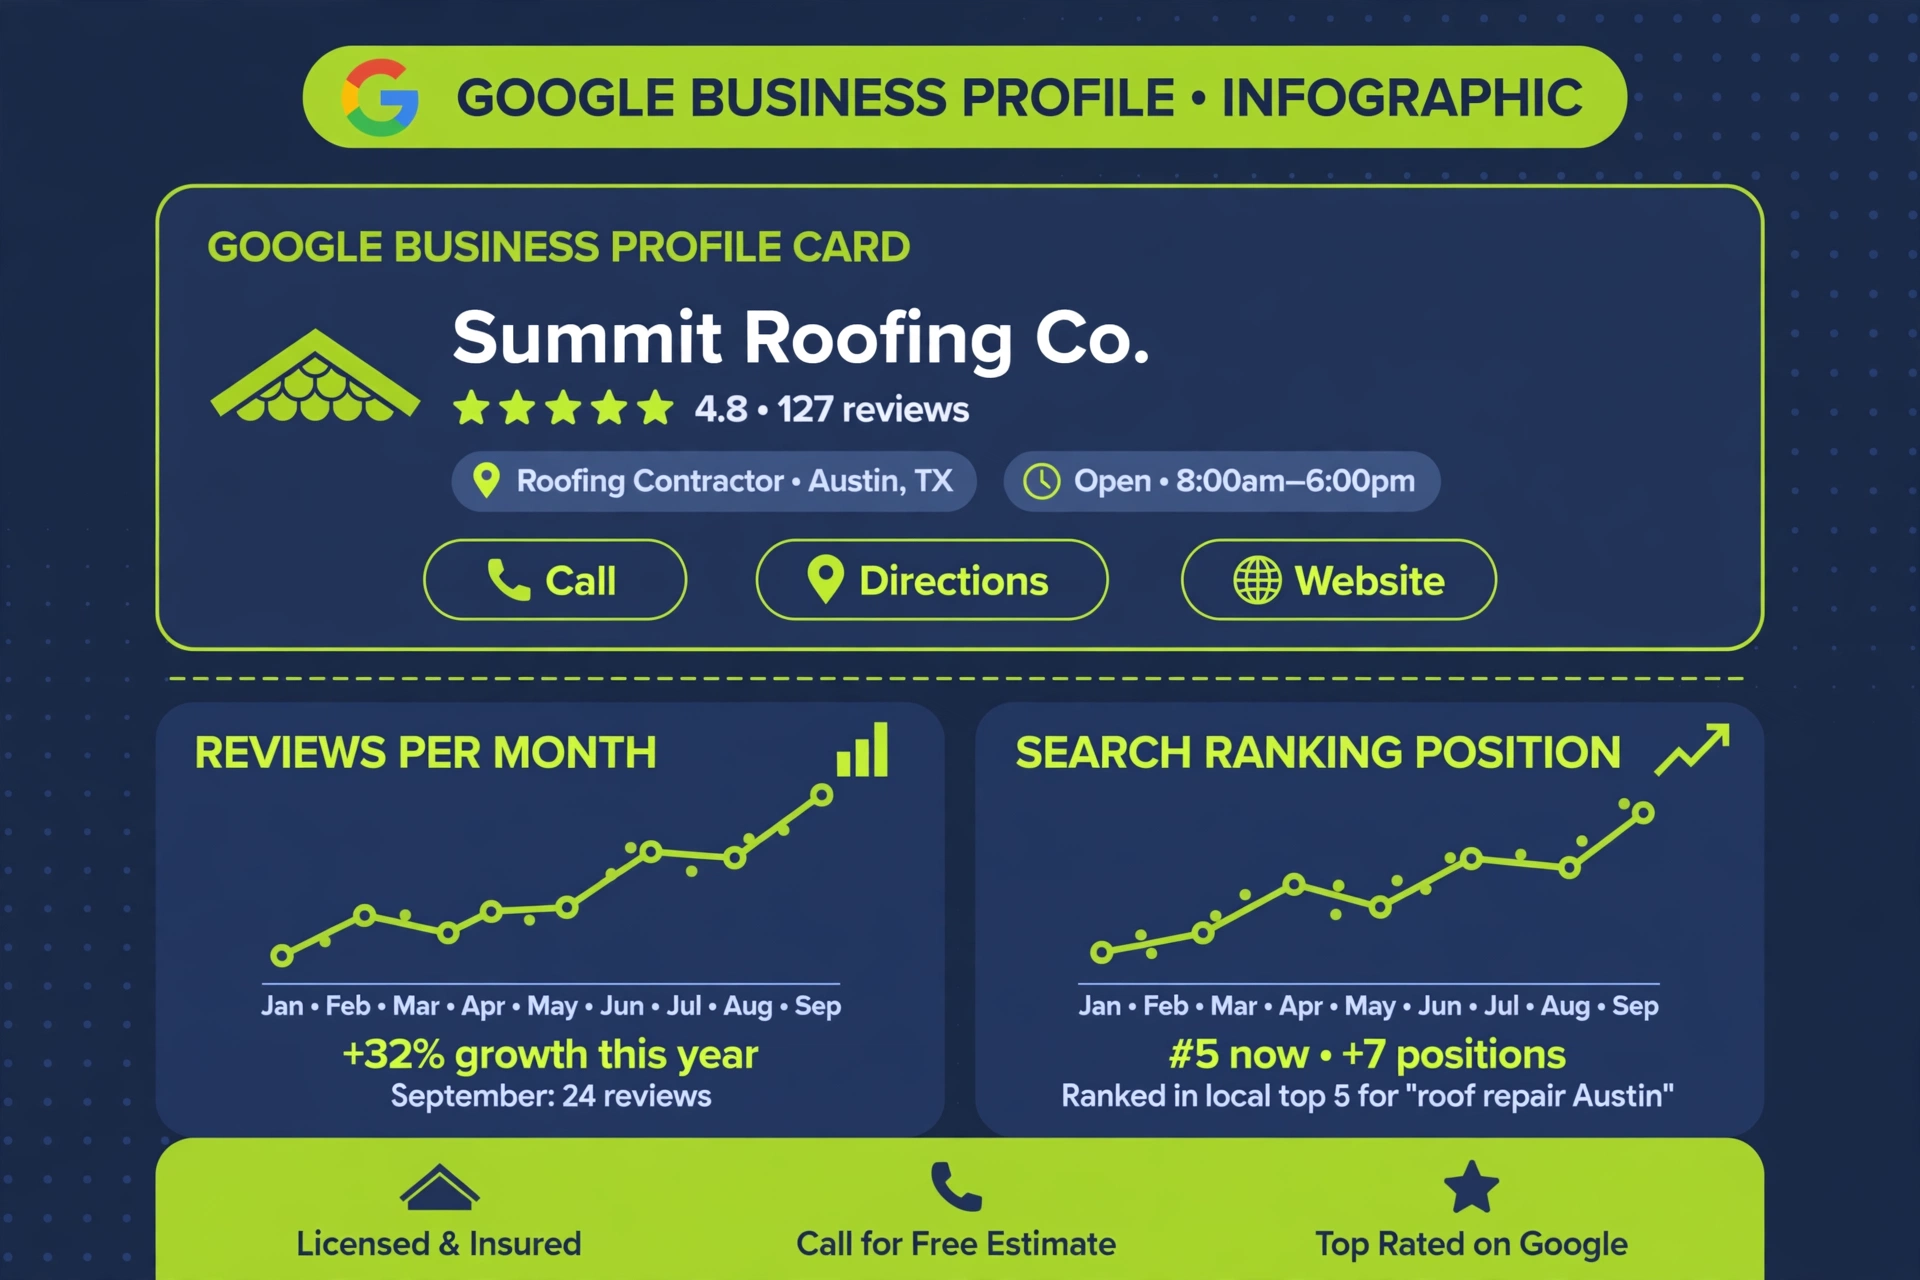
What Is Review Velocity, Exactly?
Review velocity is simply the count of new reviews your Google Business Profile receives in a rolling time window, usually measured per month. It has two dimensions: volume (how many) and freshness (how recent). A profile with 400 total reviews whose newest one is eight months old has terrible velocity. A profile with 120 reviews that added 9 this month has excellent velocity. Google reads momentum, not just mass.
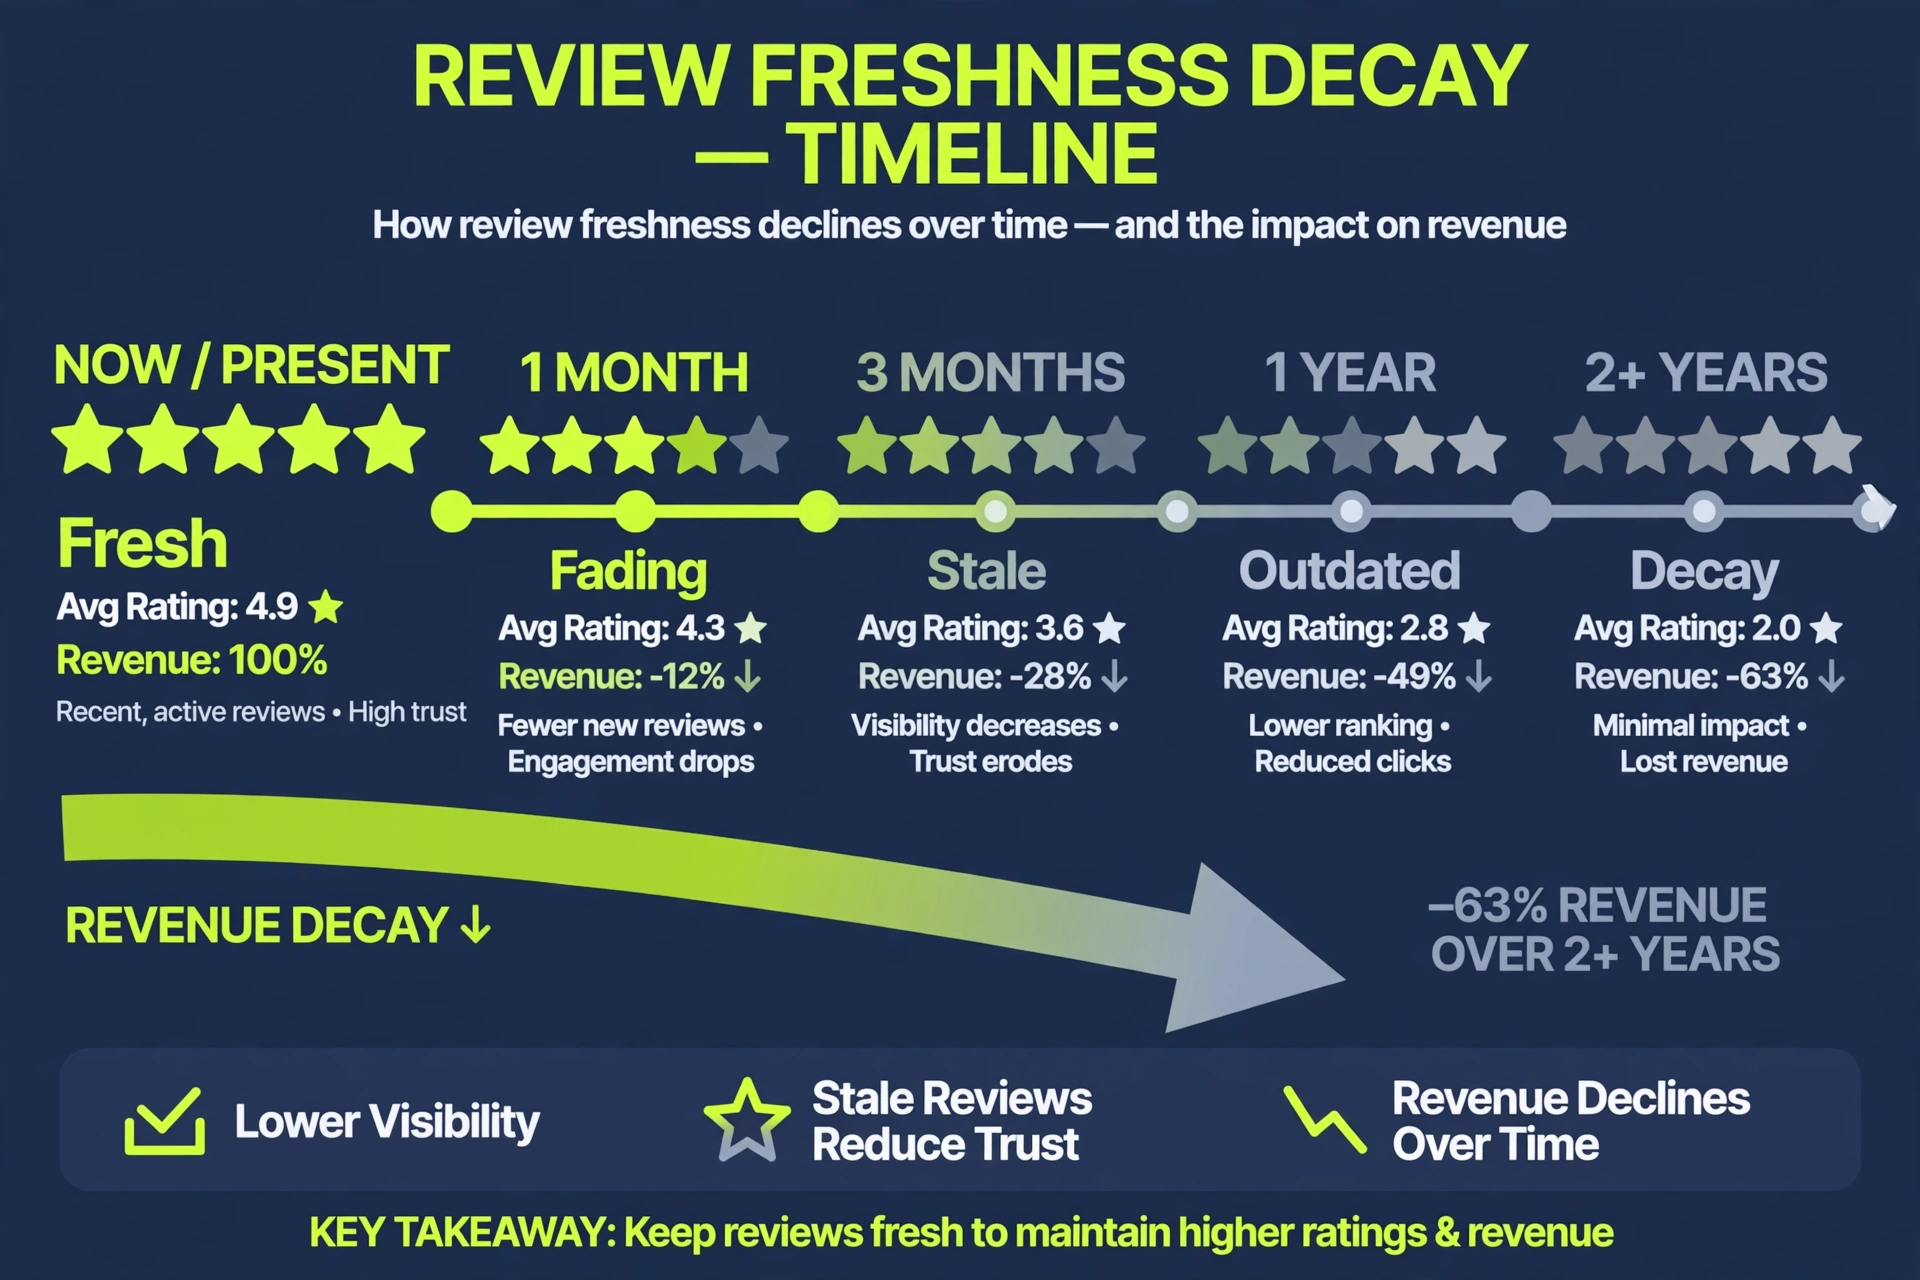
Why does the ranking algorithm care? Think like Google for a second. A homeowner searching “roof replacement near me” after a hailstorm wants a roofer that is active, current, and trusted right now. Fresh reviews are evidence the business is operating and satisfying customers today. A profile with a stale review stream looks dormant, and Google demotes dormant-looking profiles in favor of ones with a living reputation. This is not speculation: every local SEO ranking factors study published in recent years consistently places review signals among the top three local pack factors, and velocity/recency components within that are well documented.
For roofers this matters more than for most trades, because roofing is a high-trust, high-ticket, episodic purchase. The average homeowner hires a roofer once a decade. They cannot rely on past experience; they lean hard on social proof. And Google knows searchers click the businesses with fresh, growing review counts at far higher rates than the ones with static profiles.
How Does Review Velocity Actually Move Your Ranking?
Here is the mechanism, step by step.
Step 1: Freshness feeds the local pack. Google’s local ranking blends relevance, distance, and prominence. Prominence is the one you can move, and review signals — count, rating, velocity, and review text — are its core inputs. When two roofers in the same zip code are otherwise matched, the one adding reviews steadily tends to hold the higher map position. This shows up as a pattern across markets: roofers that launch a post-job review request system reliably climb 2 to 5 positions in the pack within 60 to 90 days (illustrative based on observed patterns; results vary by market).
Step 2: Position controls click share. The top 3 local pack results capture the overwhelming majority of clicks — search industry studies consistently put the top organic/local results at 30 to 50 percent of clicks combined. Dropping from position 2 to position 6 can cut your click volume by more than half. For a roofing keyword like “roof replacement [city]” that difference is not vanity; it is a raw count of estimate requests.
Step 3: Clicks convert to calls and estimates. A roofing Google Business Profile with strong review velocity also converts better on the click itself: the “9 reviews this month” freshness signal and the recent review dates reassure the homeowner before they ever dial. So velocity helps twice — more clicks, and a higher share of those clicks becoming calls.
Step 4: Reviews keep compounding. Every new job from a velocity-driven lead is itself a new review opportunity. Ask for the review at the right moment, velocity stays high, ranking holds, leads keep coming. It is a flywheel. The reverse is also true: let velocity stall, ranking slips, leads thin out, fewer jobs mean fewer review opportunities, and the stall becomes a spiral.
What Are the Real Numbers for a Roofing Company?
Let us work a real example. Take a typical residential roofing company in a mid-size market: average replacement job value $9,500, estimate-to-job close rate of 30 percent, and currently ranking around position 5 in the local pack for their main keywords.
The baseline (low velocity): The profile has 90 reviews, average 4.7, but the newest review is 4 months old and the company adds roughly 1 review per month. At position 5, the profile captures roughly 8 percent of pack clicks. Say their main keywords drive 300 pack impressions a month. That is 24 clicks, and with a typical 10 percent click-to-call rate, about 2 to 3 calls a month from the profile. At a 30 percent close rate and $9,500 average jobs, that is roughly 1 job, or about $9,500 a month in revenue tied to the profile (illustrative math).
The target (healthy velocity): The same company builds a post-job text system and starts earning 8 reviews per month. Within two to three months the profile climbs to position 2. Click share rises from roughly 8 percent to roughly 30 percent. Same 300 impressions now mean 90 clicks, about 9 calls, and at the same close rate, nearly 3 jobs a month — roughly $28,500 in profile-attributed revenue.
The gap: The difference is about $19,000 a month, or $228,000 a year, from the same keywords, the same job values, the same close rate. The only change is review velocity moving the ranking. (All figures illustrative; your numbers will differ by market, impression volume, and conversion rates — which is exactly why you should run them yourself.)
Now look at it from the other direction: what does low velocity cost per month of delay? Every month the profile sits stale at position 5 instead of climbing to position 2 is a month of that $19,000 gap. The cost of “we will get to reviews eventually” is not abstract. It is roughly one average roof job per month, walking to a competitor with a busier review stream.
Want to see the gap in your own numbers instead of my illustration? Run your own numbers in the free Revenue Leak Calculator — plug in your impressions, your job value, and your close rate, and it prices the leak for your company specifically.
What Velocity Should a Roofer Actually Target?
There is no magic universal number, because velocity is relative to your market. But there are workable rules.
Minimum viable: 4 to 6 reviews per month. Below this, your profile reads dormant to Google and to homeowners. In most mid-size markets this is enough to stop sliding, but rarely enough to climb.
Competitive: 8 to 12 reviews per month. This is the band where roofers hold top-3 pack positions in most markets. It also generates enough review text for keyword richness (homeowners naturally mention “roof replacement,” “storm damage,” “insurance claim” in reviews, which feeds relevance).
Dominant: 15+ reviews per month. In storm-hit markets and dense metros, the roofers visibly winning the pack sit here. At this pace, your profile’s newest review is never more than a day or two old, and that freshness signal is unmistakable.
Relative matters more than absolute. If your top three competitors are adding 10 a month and you add 4, you are losing ground even though 4 feels fine. Pull up their profiles, count the last 90 days of reviews, and that is your real target: match the market leader’s pace, then beat it.
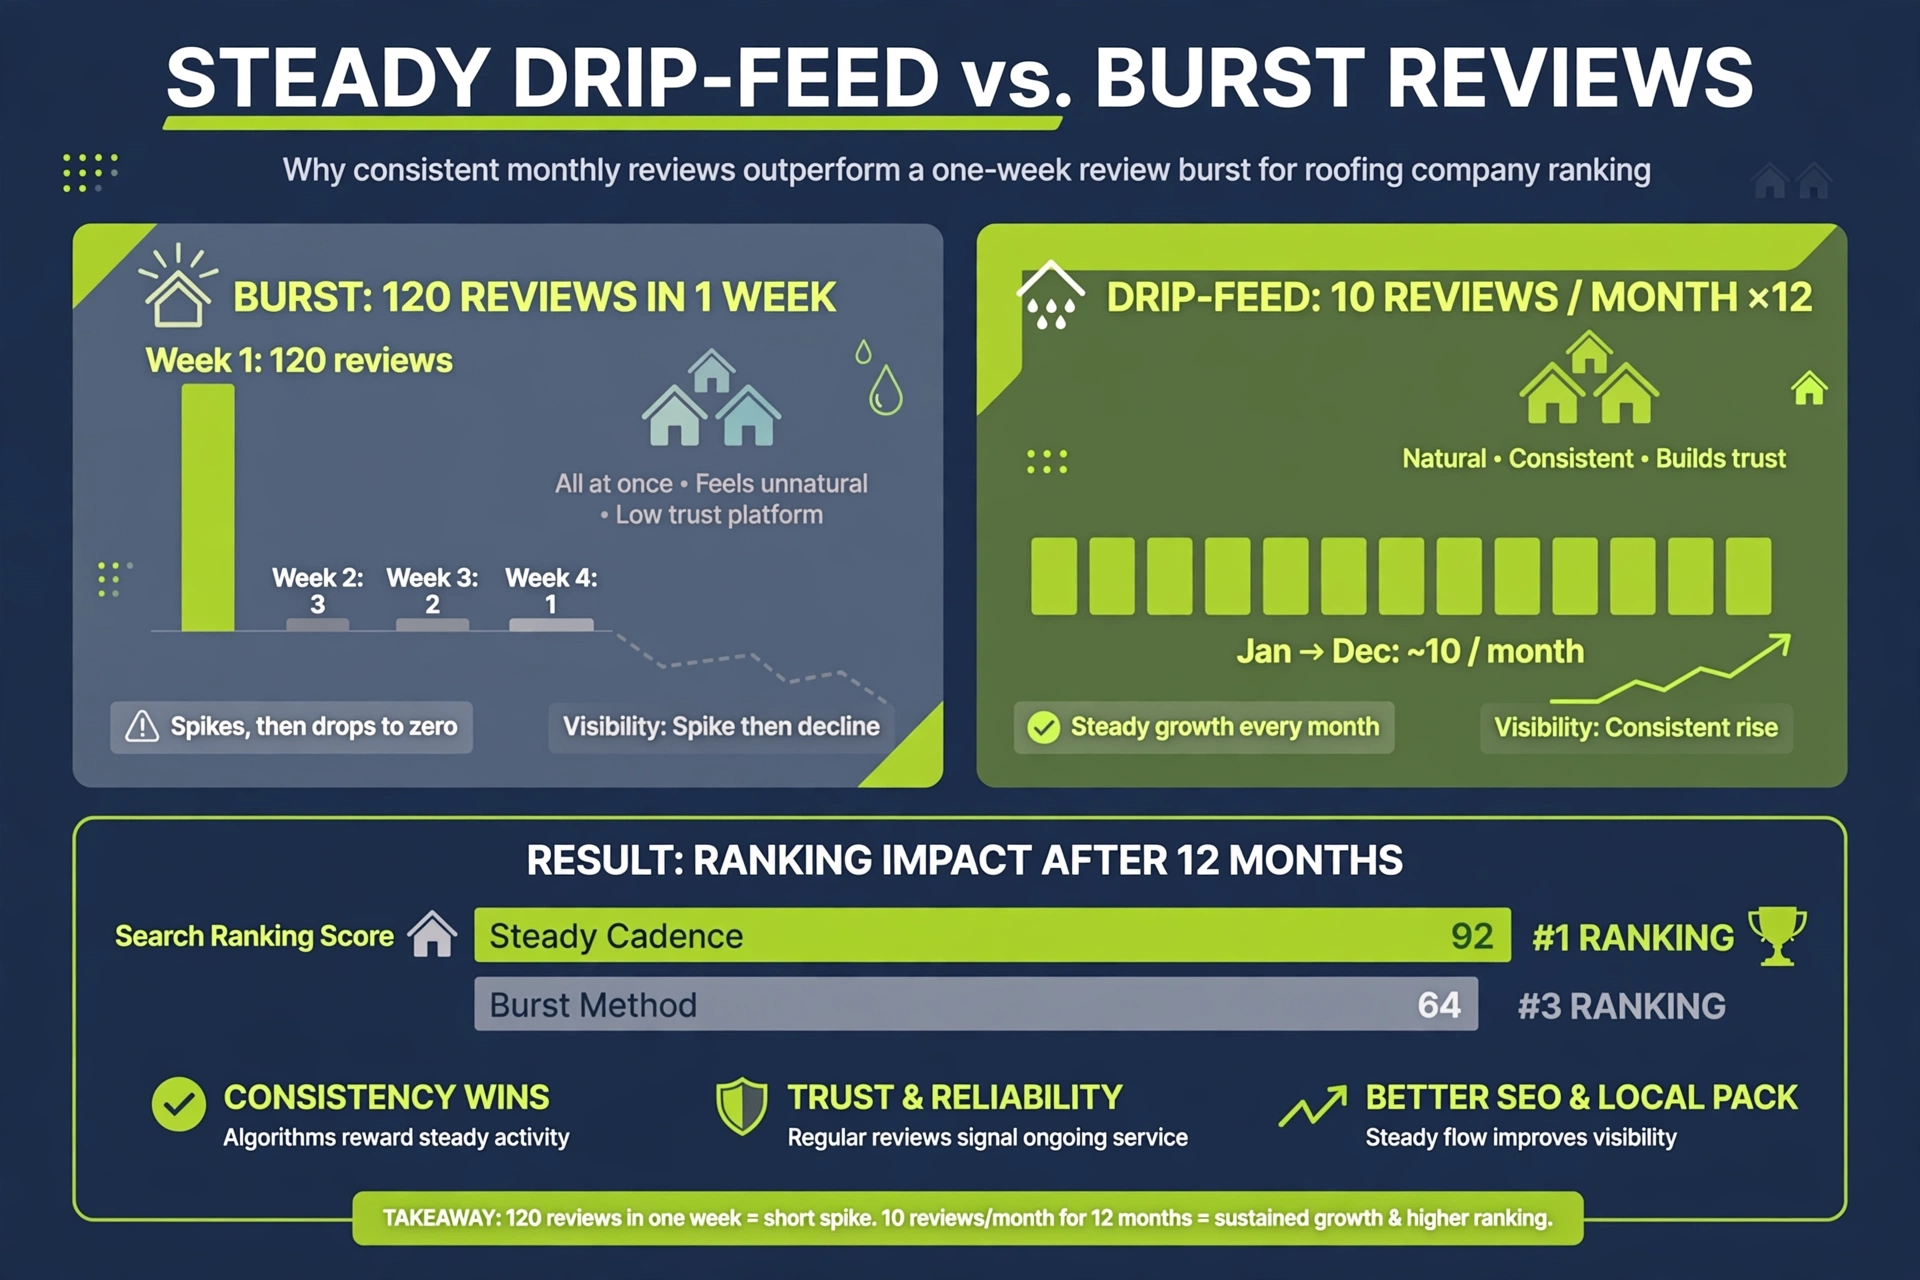
One caution: velocity must look human. Fifty reviews in a weekend followed by three months of silence is the classic burst pattern, and Google is good at spotting it. The same fifty reviews spread evenly across three months is the drip pattern that ranks and sticks. Steady beats spiky every time.
How Do Roofers Keep Velocity Steady Without Begging?
The roofers holding 8 to 12 reviews a month are not luckier or friendlier. They run a system. Here is the structure that works.
The 24-hour post-job text. Within a day of final inspection and final payment, the homeowner gets a short text: a thank-you, the direct Google review link, and nothing else. Timing is everything — satisfaction peaks at job completion and decays fast. Companies that send within 24 hours routinely see 20 to 30 percent of jobs convert to reviews (illustrative industry benchmarks); waiting a week cuts that roughly in half.
The polite second touch. One follow-up text 5 to 7 days later for anyone who has not left a review. No guilt, no discount bribe — just a reminder with the link. This single follow-up typically recovers another 10 to 15 percent of the remaining jobs into reviews (illustrative).
The crew’s role. The crew chief mentions at final walkthrough that a text with a review link is coming, and that reviews genuinely help the company. That 20-second mention lifts response rates noticeably because the request arrives from a face, not a brand.
The insurance-claim blind spot. Roofers consistently forget to request reviews on insurance-claim jobs, which can be a third or more of a storm-season book. Those homeowners are just as satisfied — they got a new roof for their deductible — and their reviews mentioning the claims process are gold for relevance. Systematize the ask on claims jobs too.
The negative-review filter trap. Do not gate the request — never filter “happy only” before sending the link. Gating violates Google policy and the pattern is detectable. Send to every completed job. If service is good, the math works out; a steady stream of 5-star reviews buries the occasional 4-star, and a visible 4.8 with 200 fresh reviews converts better than a 5.0 with 12 stale ones.
What Does a Dead Review Stream Cost Over a Year?
Let us annualize the earlier example, because monthly math understates the pain.
The stale year: 1 review per month velocity, position 5, about 1 profile-driven job per month, roughly $114,000 a year in profile-attributed revenue.
The healthy year: 8 to 10 reviews per month velocity, position 2, about 3 profile-driven jobs per month, roughly $342,000 a year.
The annual gap: about $228,000. Same crew, same trucks, same ad spend, same market. The difference is a text message system that takes an afternoon to set up. There are very few line items in a roofing company’s P&L with a 1000-to-1 return on effort, and review velocity is one of them.
And the compounding detail people miss: reviews also lift paid performance. A Google Ads listing tied to a profile with 200 recent reviews and a 4.8 rating gets higher click-through and better Quality Signals than the same ad on a stale profile. So velocity leaks into your paid channels too, in both directions.
How Do You Measure Velocity Week to Week?
What gets measured gets managed. Track three numbers on a simple weekly sheet.
1. New reviews this week (count). The raw input. Target: 2 to 3 per week for a one-to-two-crew residential roofer. 2. Reviews in the last 90 days. The number Google and homeowners actually feel. Target: at least 25 to 30. 3. Newest review age. The freshness check. Target: never older than 7 days.
Review this sheet every Monday. If newest-review age crosses two weeks, the system has a hole — usually the post-job text stopped going out, or the crew stopped mentioning it. Fix the system, not the symptom.
Bottom Line
Review velocity is the monthly rhythm of new reviews on your Google profile, and it is one of the heaviest levers on your local ranking for roofing keywords. The math is unforgiving: a stale profile can cost a typical residential roofer six figures a year in profile-driven revenue versus the same company running a steady 8-to-10-review-per-month system. Set the target at your market leader’s pace, build the 24-hour post-job text, and measure weekly.
This is the kind of system RepuPilot is built to run in the background for roofing companies — steady review generation, review velocity that never stalls, and every review working your ranking while you are on the roof. And if you want the leak priced in your own numbers first, run your own numbers in the free Revenue Leak Calculator — it takes a minute, and the gap is usually bigger than owners expect.
FAQs
How many reviews per month does a roofer need to rank? In most mid-size markets, 8 to 12 new reviews per month holds a top-3 local pack position. Competitive storm markets and dense metros need 15 or more. Measure against your top three competitors’ 90-day pace — match the leader, then beat it.
Does Google penalize getting too many reviews too fast? Google does not publish a penalty threshold, but unnatural burst patterns — dozens of reviews in days after months of silence — are widely reported to trigger filtering. Steady, drip-fed velocity is both safer and more effective.
Do review responses affect velocity? Responding to reviews does not change your velocity number, but owner responses raise the profile’s overall prominence and conversion signals. Respond to every review; it amplifies what velocity earns you.
How long does it take for review velocity to move rankings? Most roofers see movement within 60 to 90 days of starting a consistent request system, assuming the rest of the profile is healthy. Markets with entrenched competitors may take longer.
Are bought or incentivized reviews worth the risk? No. They violate Google’s policy, they get filtered or removed in waves, and a profile caught with fake reviews loses homeowner trust permanently. Earned reviews through a request system outperform them anyway.
What is the best time to ask a homeowner for a review? Within 24 hours of final inspection and final payment, when satisfaction peaks. A short text with the direct Google review link at that moment converts at the highest rate of any touchpoint.
Does review velocity matter if my rating is already 4.9? Yes. A 4.9 with no reviews in six months loses to a 4.7 adding 10 reviews a month in the local pack. Rating is the snapshot; velocity is the movie, and Google watches the movie.