
Most roofers know their cost per lead to the dollar. Almost none know their cost per booked job. The gap between those two numbers is where profit quietly disappears.
Cost per booked job is your total lead spend divided by the jobs you actually book. Most roofers track cost per lead and assume a $100 lead is a $100 lead. It is not. Leads leak at every stage between the inquiry and the signed contract: the unanswered call, the form nobody called back, the estimate that never closed. Because of those leaks, the true cost per booked job usually runs two to four times the cost per lead.
This post builds the stage-by-stage leak math — inquiries to answers to estimates set to estimates run to jobs booked — finds the leak rate at each stage, and shows how fixing the cheapest leak drops your cost per booked job, with a full worked example.
Quick Answer:
Cost per booked job is your total lead spend divided by the jobs you actually book. Most roofers track cost per lead ($60–$200) but never count what leaks at each stage — unanswered calls, slow response, no-show estimates. Because of those leaks, the true cost per booked job usually runs two to four times the cost per lead.
What Is Cost Per Booked Job, and Why Does Cost Per Lead Lie to You?
Cost per lead answers a shopping question: how much does attention cost? Cost per booked job answers the business question: how much does actual work cost? Roofers who optimize for the first number routinely overpay for the second.
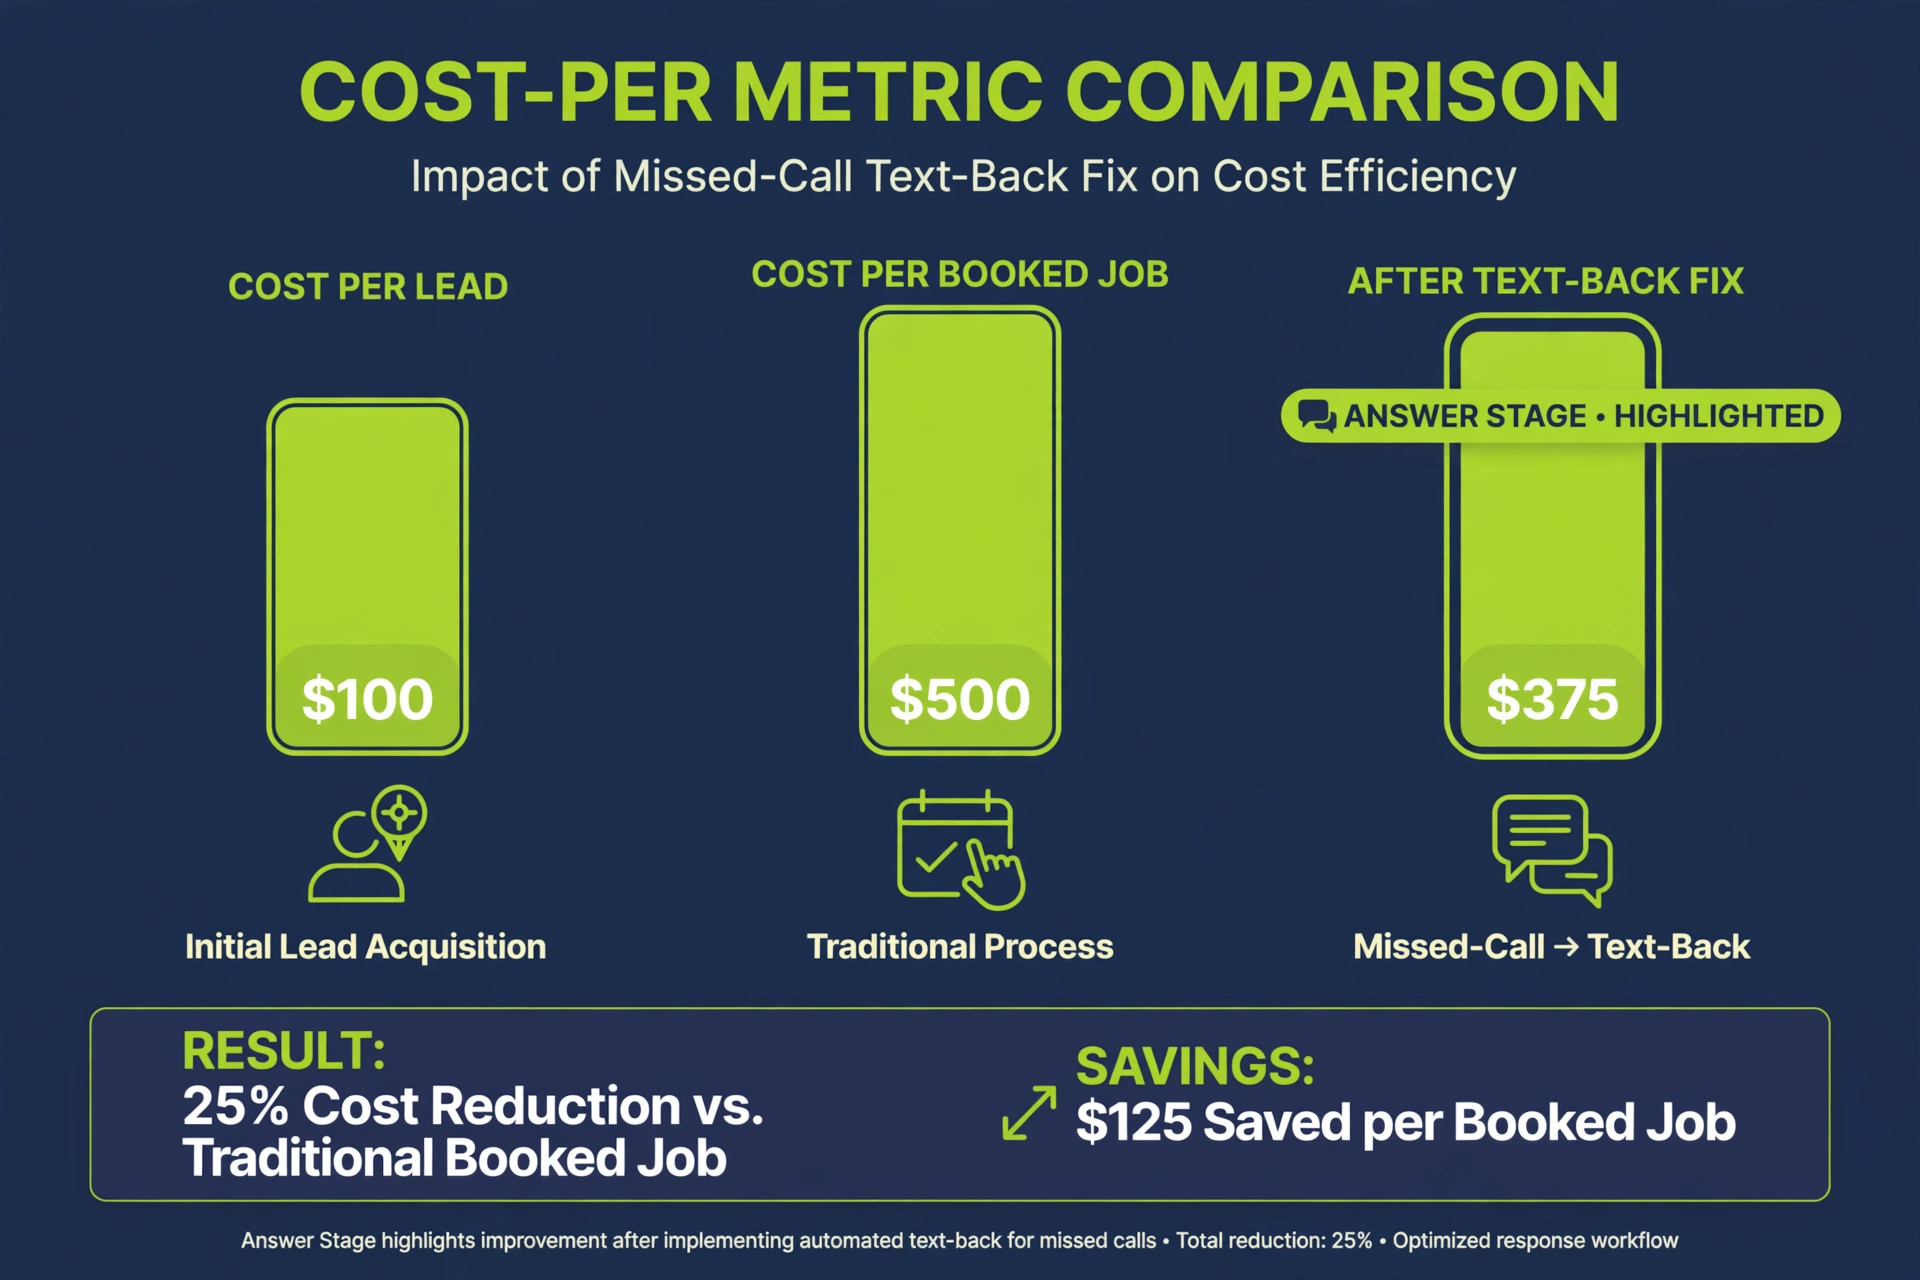
Spend $3,000 a month at an illustrative $100 per lead and you buy 30 inquiries. If 6 become booked jobs, your cost per booked job is not $100. It is $500: $3,000 divided by 6. The $100 figure describes what you bought; the $500 figure describes what you kept.
Where Do Roofing Leads Actually Leak?
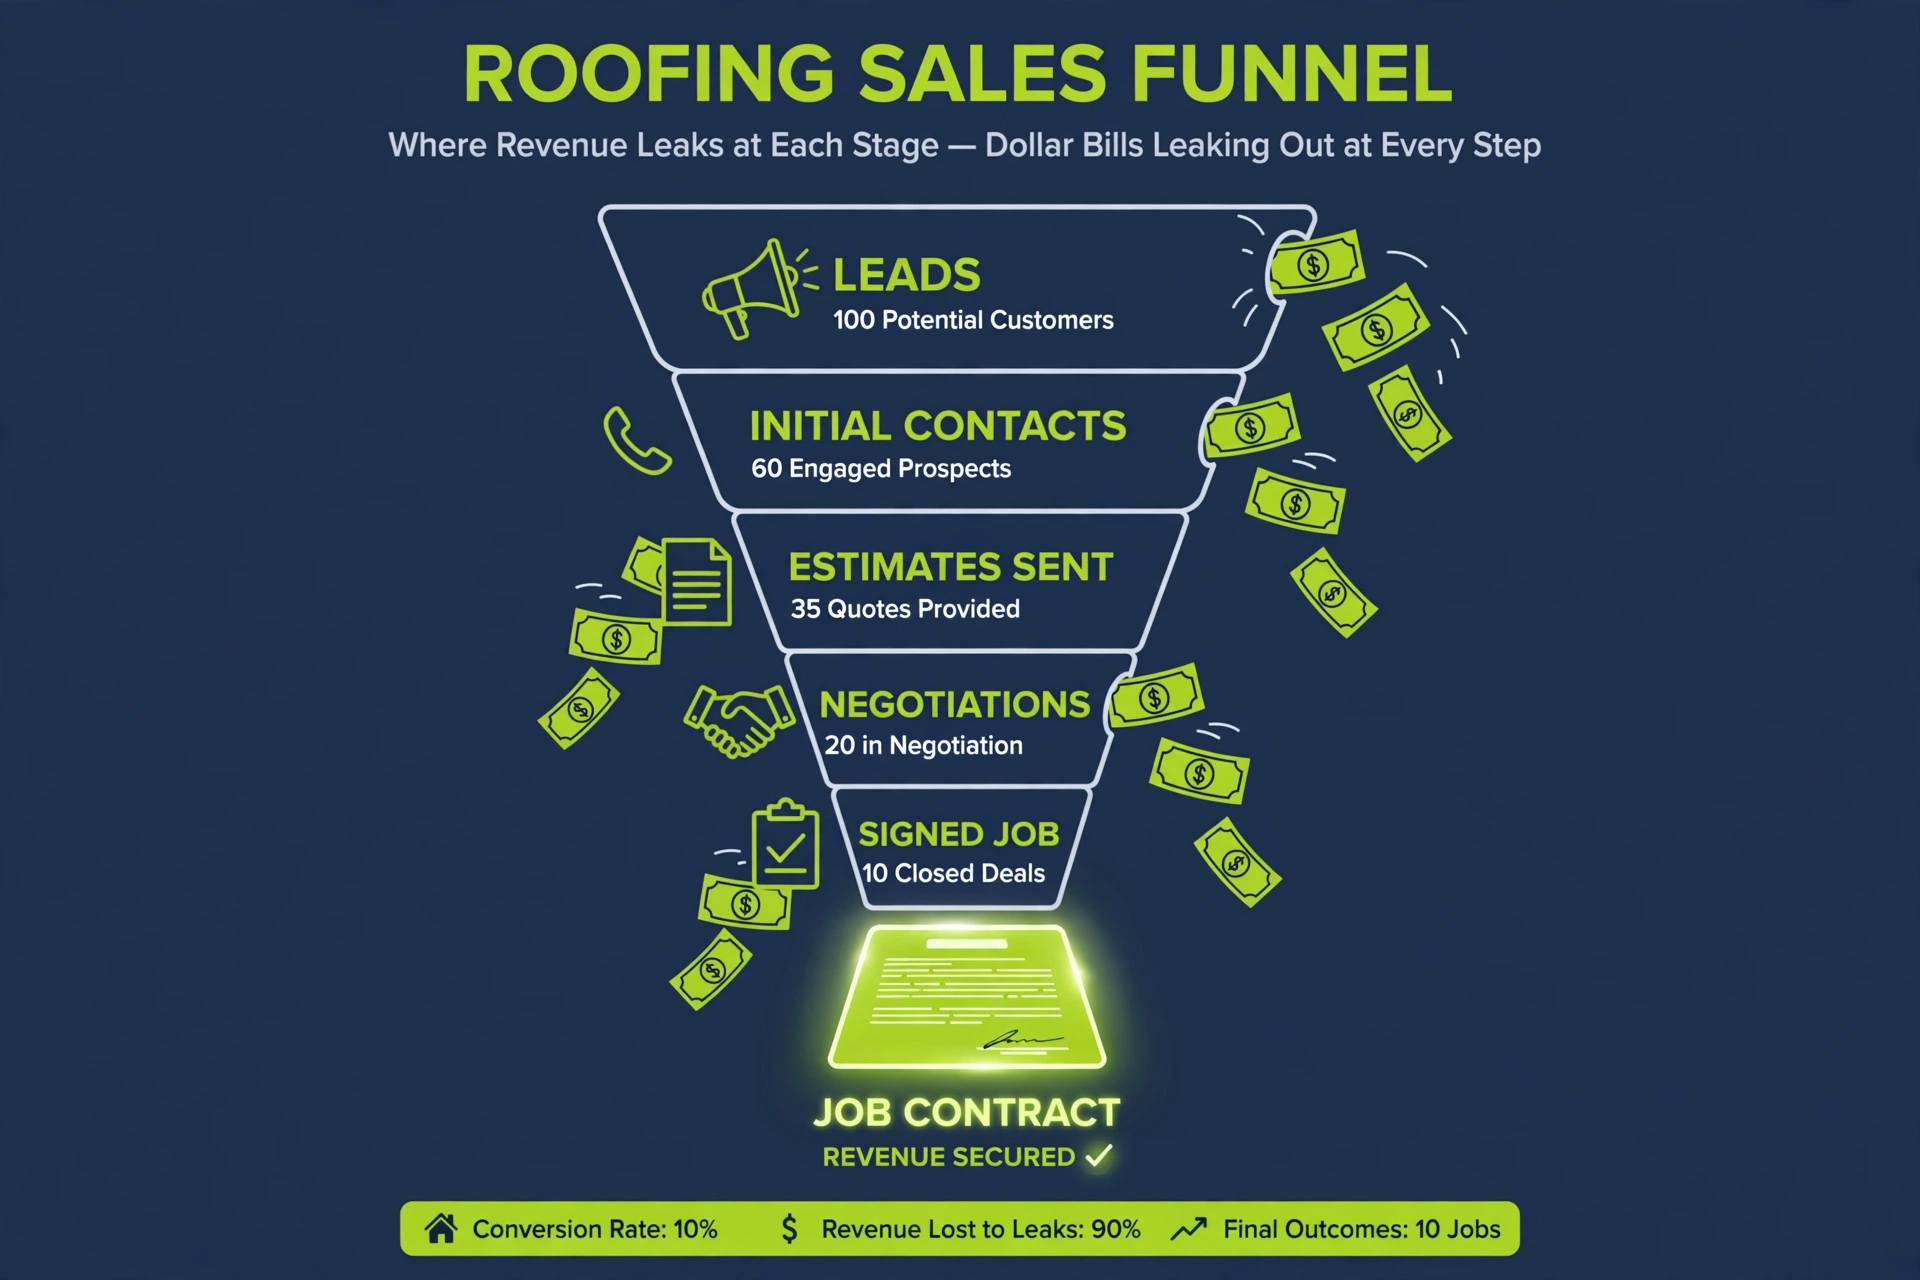
The funnel, as a roofer lives it: inquiries, answers, estimates set, estimates run, jobs booked.
Inquiries. Calls, estimate forms, Google Business Profile messages. Not leads yet; attempts to reach you. They leak the moment nobody picks up.
Answers and contact. How many inquiries become a real conversation? Voicemails never returned and forms sitting in the inbox since Tuesday die here.
Estimates set. How many conversations become an inspection appointment? This is where one-touch estimating kills you: a ballpark over the phone that never becomes a real inspection. It is also where slow follow-up bleeds out, because the homeowner who requested three quotes books the roofer who called back first.
Estimates run. How many appointments actually happen? No-shows are the most expensive leak in roofing: you paid for the lead, paid to set it, and now you are burning windshield time driving to an empty driveway.
Jobs booked. How many estimates become signed contracts? Your close rate, where insurance-claim handling, financing, and claim-paperwork follow-up live.
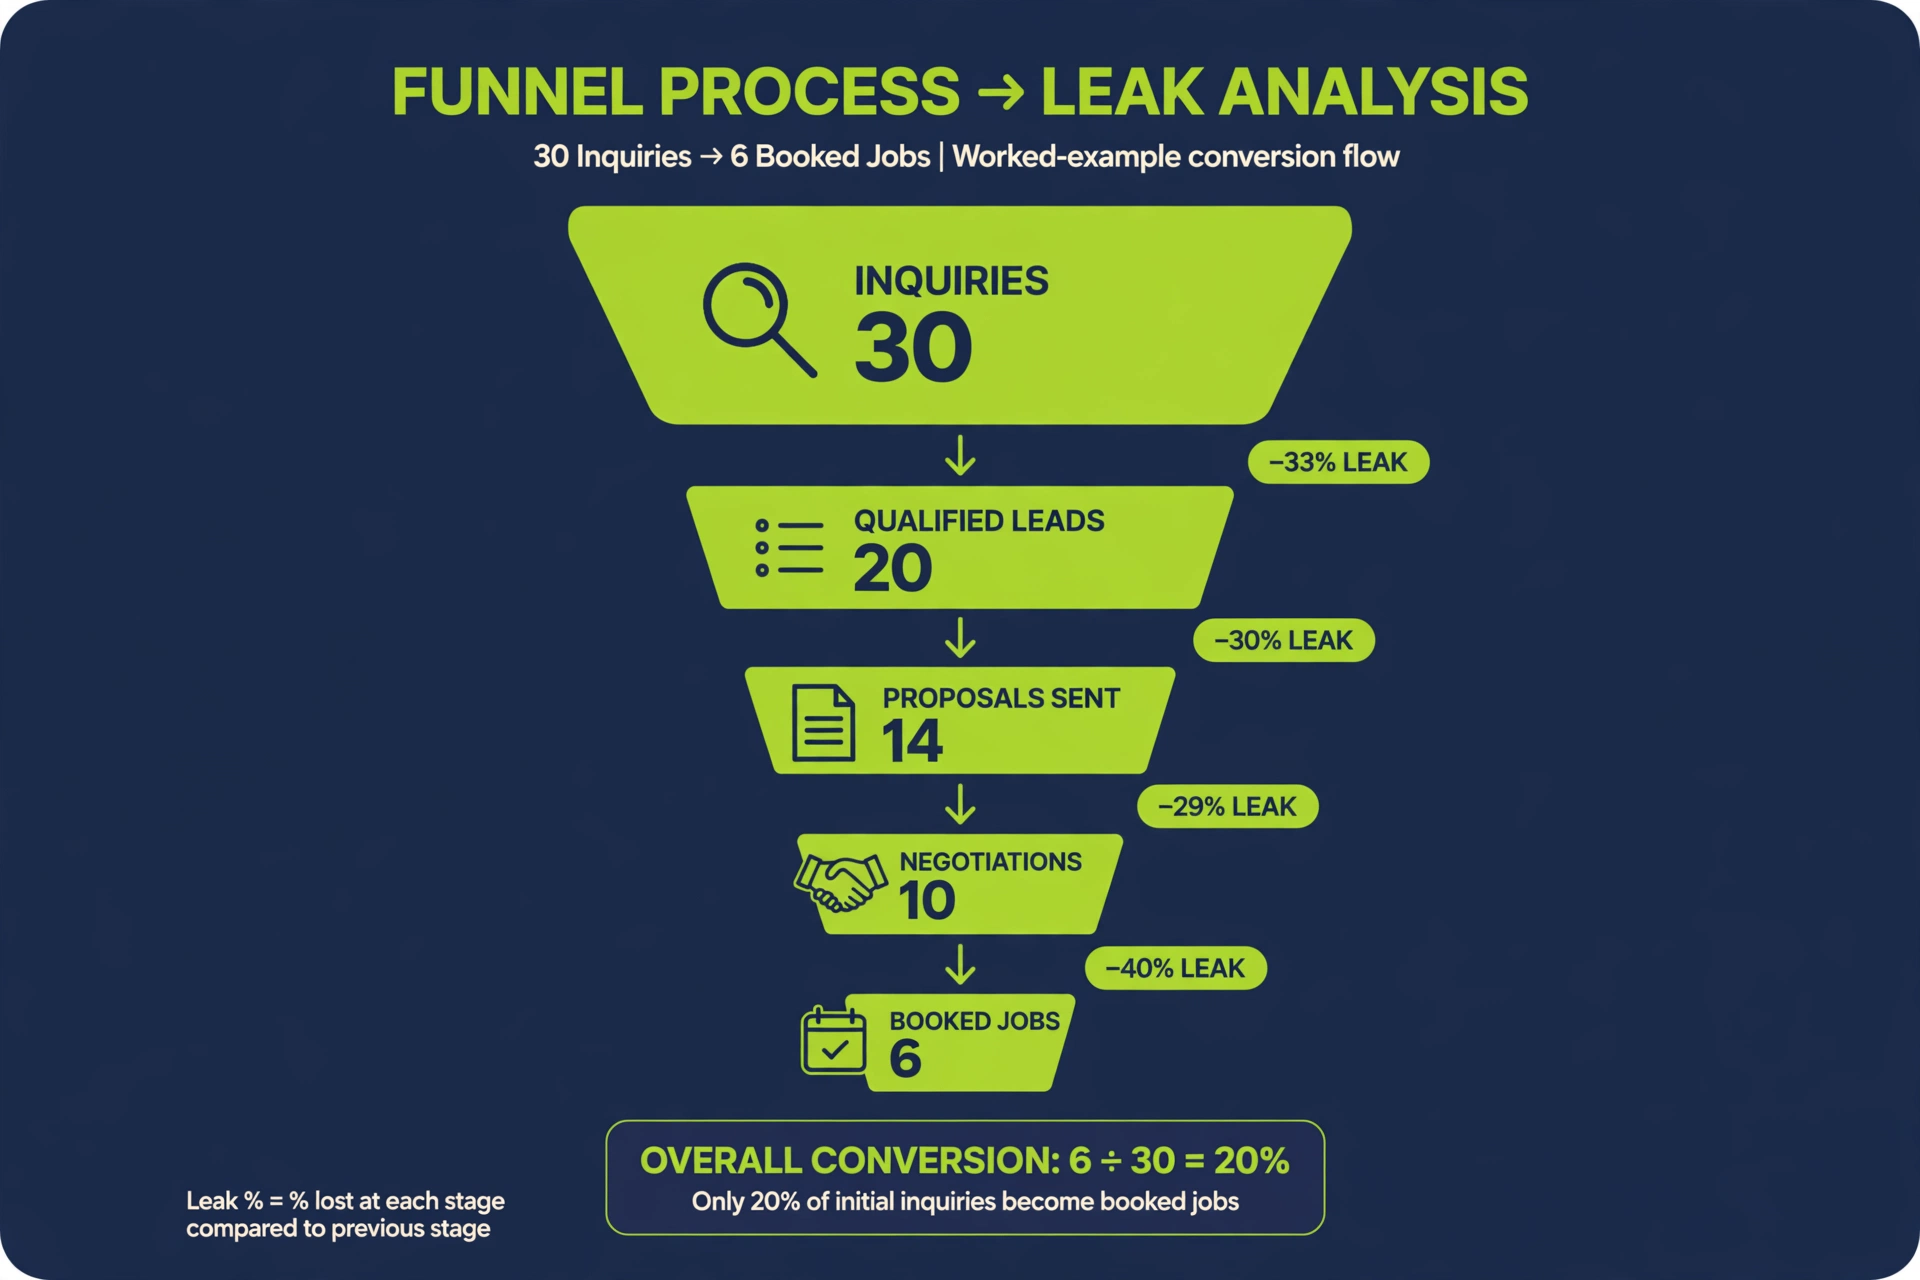
These stages multiply. Lose a third at each of four arrows and you do not lose a third of your inquiries. You lose 80%: 30 inquiries at the top become 6 jobs at the bottom.
How Do You Measure the Leak Rate at Each Stage?
The formula is one line, the same at every stage:
Leak rate = (came in − went out) ÷ came in.
Take the last 60 days and pull seven numbers: inquiries in, conversations held, estimates set, estimates run, jobs booked, total lead spend, and your average job value. Then compute the leak at each arrow. If 30 inquiries produced 20 conversations, your answer leak is (30 − 20) ÷ 30 = 33%. These four numbers are your true leak rates.
Two honesty rules. First, a voicemail returned two days later is not “answered”; by Tuesday the homeowner had already picked one of the three roofers she called. Second, do not merge stages. “We set most of our estimates” is not a number. The number is how many conversations became calendar appointments, and it is almost always lower than it feels from the truck.
Run the audit once and it takes an hour. Run it monthly and it takes twenty minutes. An agency that only reports lead volume is grading its own homework.
What Does the Math Look Like on a Real Funnel?
Every number below is illustrative; substitute your own counts. Setup: $3,000/month spend, $100 cost per lead (illustrative), 30 inquiries.
- Inquiries → answers: 30 in, 20 become conversations. Leak rate: 33%. Calls that hit voicemail during work hours; forms that sat in the inbox until Thursday. Context: an 85-business study found 62% of inbound calls went unanswered (411 Locals), while CallRail’s much larger 2025 dataset puts the average near 28%.
- Answers → estimates set: 20 in, 14 inspection appointments. Leak rate: 30%. Phone estimates never scheduled; a form lead called back a day late who had already booked someone.
- Estimates set → estimates run: 14 in, 10 happen. Leak rate: 29%. Two forgot, one got a cheaper quote that morning.
- Estimates run → jobs booked: 10 in, 6 signed. Leak rate: 40%. One lost to a storm-chaser’s undercut, two stuck “waiting on the insurance adjuster.”
Totals: 30 inquiries, 6 jobs booked. Total leak: 80%. Cost per booked job: $3,000 ÷ 6 = $500. The $100 lead is a $500 job.
Now close only the cheapest leak, the answer stage, with a missed-call text-back that fires automatically on every unanswered call. Say it recovers 5 of the 10 lost conversations (illustrative). Nothing else changes: 25 → 18 estimates set → 13 run → 8 booked, same downstream rates.
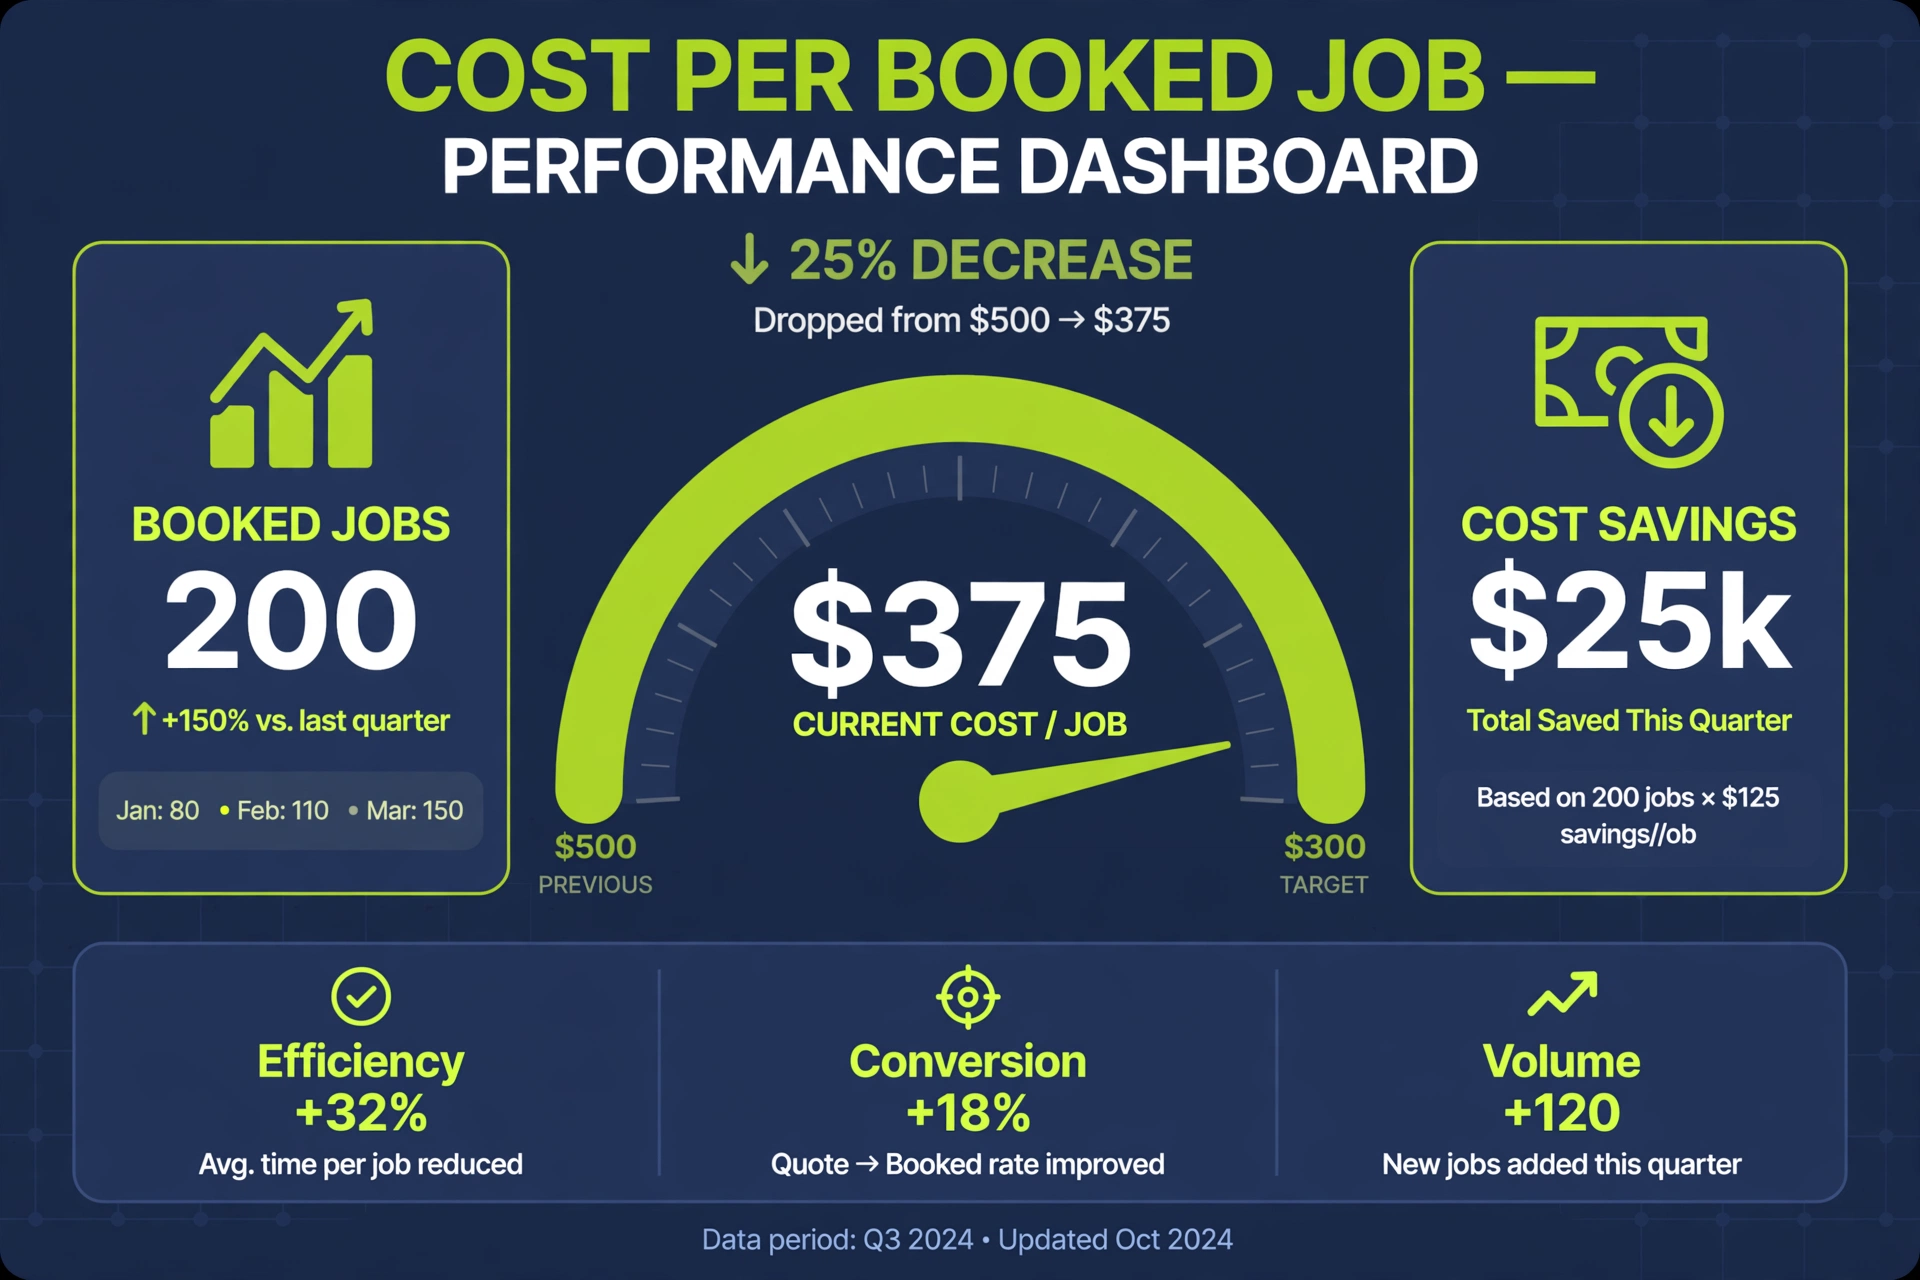
Same $3,000 spend. Jobs booked: 6 → 8. Cost per booked job: $500 → $375. At an illustrative $10,500 average replacement value, those 2 extra jobs are $21,000 a month in revenue from a fix that costs less than a tank of gas. That is the whole game: fewer leaks, starting with the cheapest one.
Run your own numbers in the free Revenue Leak Calculator: plug in your monthly lead spend, your cost per lead, and your best guess at each stage’s leak rate, then watch what happens when you close the cheapest leak first.
Which Leak Is the Cheapest to Fix First?
1. The answer leak: cheapest. A missed call that gets an automatic text back within 60 seconds is recovered before the homeowner dials the next roofer. No new hire, no behavior change from your crew: a systems fix you can close in an afternoon.
2. The follow-up leak at estimates set: cheap. Most roofers make one callback and move on. The fix is a follow-up sequence over 3 to 5 days with a real reason to re-engage. It costs effort, not headcount, and every old estimate-request list in your CRM is a reactivation list.
3. The no-show leak: moderate. Reminders are cheap, but the leak has real causes: appointments set too loosely, homeowners never qualified, no confirmation step.
4. The close-rate leak: most expensive. Better closing means better salespeople, training, financing, sharper claim handling. Real work with real cost, and the last place to look: a 10-point close-rate improvement on 10 estimates is one extra job.
Attack top of funnel first: every leak closed upstream feeds the stages below, which is why one fix took the example from $500 to $375.
Why Does Speed to Contact Change the Entire Funnel?
Because the answer stage is really two leaks wearing one costume: the call you never picked up, and the inquiry you picked up too late.
The landmark Lead Response Management study by Dr. James Oldroyd at MIT, run with InsideSales.com, found that contacting a lead within 5 minutes makes you roughly 100 times more likely to reach them, and about 21 times more likely to qualify them. Velocify’s later analysis of roughly 3.5 million leads found calling within one minute lifts conversion by up to 391%. And the average business still takes around 42 hours to respond (Harvard Business Review).
In roofing, the homeowner is not waiting 42 hours. She requested estimates from three roofers on the same call with her insurance company. The roofer who called back in six minutes got the inspection; the roofer who called back the next morning got a polite “we already found someone.” His cost per booked job knows the truth.
Split the answer stage by time of day at least once: a large share of roofing inquiries arrives outside business hours, and a funnel that goes dark at 6 p.m. leaks nearly 100% of them. Treat contact speed as a measured metric, median minutes from inquiry to first contact.
What Should Your Target Cost Per Booked Job Be?
There is no universal benchmark: a roofer in a hail-heavy market buying $200 storm leads has a different target than one in a referral-heavy market buying $60 search leads:
Target cost per booked job = average job value × the marketing share you can afford.
Work it backwards with illustrative numbers: at an illustrative $10,500 average replacement value, 8% of revenue to acquire the job puts your ceiling at $840 per booked job; at 5%, the ceiling is $525. (Use your own books.) If your measured number sits under your ceiling, the funnel is working. If it sits above, the fix is not more ad spend. It is the leak audit.
Two cautions. Measure over 60 to 90 days, not one month; storm spikes and one big commercial job distort a single month into panicked decisions like pausing ads that were working. And watch crew capacity: dropping from $500 to $375 means roughly 33% more jobs from the same spend. If your crews are booked eight weeks out, the next leak to fix is scheduling, not marketing.
Bottom Line
Cost per lead is a shopping receipt. Cost per booked job is the profit-and-loss statement. The example above showed a roofer paying $100 per lead and $500 per booked job, an 80% total leak, and one cheap fix, the missed-call text-back, that dropped the number to $375 and added two jobs a month at zero extra ad spend. Your numbers will differ. The shape will not: leads leak at every stage, the leaks compound, and the cheapest fixes sit at the top of the funnel.
The audit itself is the valuable part: one hour with your last 60 days of numbers gives you four leak rates and a true cost per booked job, replacing every lead-volume report your agency sends you. This is exactly the kind of system RepuPilot builds for roofing companies: every missed call gets an instant text-back, every estimate request gets a follow-up sequence, and every stage gets measured so the leak has nowhere to hide.
Run your own numbers in the free Revenue Leak Calculator and find your true cost per booked job in two minutes. Then close the cheapest leak first.
FAQs
How do I calculate my cost per booked job? Add up everything you spent to generate inquiries over 60 to 90 days, and divide by the jobs you actually booked. Include ad spend, lead-service fees, and listing costs. Do not divide by leads. Divide by booked jobs.
What is a good cost per booked job for a roofing company? There is no universal benchmark. Build yours backwards: take your average job value, multiply by the share of revenue you can afford to spend acquiring a job (an illustrative 5 to 8%), and that is your ceiling. Under it, your funnel is healthy. Above it, run the leak audit first.
Why is my cost per lead so much lower than my cost per booked job? Cost per lead counts inquiries bought. Cost per booked job counts inquiries that survived every stage: answers, estimates set, estimates run, jobs closed. Each stage leaks and the leaks compound, so a funnel losing a third of its inquiries at every arrow turns a $100 lead into a $500 job.
What is the biggest leak in most roofing funnels? It varies by company, but the answer stage is the most common culprit. Unanswered-call data ranges from 28% in large datasets (CallRail, 2025) to 62% in a small 85-business study (411 Locals). The top of the funnel is where the most paid-for leads die.
How do I track leak rates per stage without buying new software? A spreadsheet and 60 days of records. Pull inquiries, conversations, appointments set, appointments run, and jobs booked from your call logs, calendar, and CRM, then apply the formula at each arrow: (in − out) ÷ in. Twenty minutes a month.
What is a realistic close rate on roofing estimates? No honest universal benchmark exists; it depends on your market, pricing, and how appointments get set. Measure your own over 60 to 90 days: estimates run divided by jobs signed. Treat it as the last leak to fix, not the first: close-rate improvements multiply the smallest base in the funnel, answer-rate improvements the largest.
Can I lower my cost per booked job without spending more on ads? Yes, and that is the entire point of the leak audit. The worked example dropped cost per booked job from $500 to $375 with zero additional ad spend, just by recovering lost conversations at the answer stage. Fixing leaks converts leads you already paid for.
What does a missed-call text-back cost compared to hiring someone to answer the phones? A full-time office hire runs tens of thousands of dollars a year plus training and turnover; an automated text-back costs tens of dollars a month. The automation answers at 7:40 p.m. on a Saturday in hail season. Most companies need both eventually; the automation is the cheaper leak to close first.